Arts advertising benchmarks describe two different sectors. Capacity Interactive's 2024 Cultural Compass, built on 2023 data from more than 150 arts organizations, puts the average client's annual Meta spend at $78,685. A 2024–25 survey of 25 Canadian performing arts professionals found 11 working with total annual marketing budgets under $12,000. This guide covers what the evidence says works at the smaller end: structure, creative, search, and measurement.
Most published guidance on arts advertising comes from agencies and is benchmarked on agency clients. That data is useful, but it describes organizations with dedicated staff and five-figure media budgets.
The survey Briana Doyle of Troubadours & Vagabonds Productions conducted in December 2024 and January 2025 shows the other end of the sector. Of 25 respondents, 11 reported annual marketing budgets under $12,000. Almost half had only one or two full-time marketing and communications staff, a quarter relied on part-time help, and most did not use a CRM. The sample is small and Canadian, so it is not a census. It is still a closer match for many organizations than the agency benchmarks.
The gap shows up in Capacity Interactive's own figures. Even its small-organization clients averaged about $22,000 a year on Meta alone, and paid an average cost per acquisition (CPA) of $31.29, against $12.44 for large organizations. Smaller budgets buy less brand recognition and less learning, so every purchase costs more. The rest of this guide is about getting that cost down.
What Meta says boosting is for
The survey's sharpest finding on paid social: respondents reported that boosted posts and paid event promotions were no longer driving ticket sales, and some described ads that appeared to run without producing meaningful engagement.
Part of the explanation is in Meta's own documentation. Its Business Help Center presents boosting as the quick option when the goal is engagement: getting people to see, like, comment on, and share a post. Boosted posts also come with fewer customization and targeting options than ads built in Ads Manager. A boost optimized for interaction will find people who interact, and they are not necessarily people who buy.
So the platform hasn't simply stopped working. A boost and a sales campaign are different products, and Meta says so. A campaign built in Ads Manager with a purchase objective, defined audiences, and a dedicated landing page is a different activity that happens to run on the same platform.
One detail from Capacity Interactive's benchmarks is easy to act on: Meta ads with a call-to-action button averaged a 13% higher page view rate and a 33% lower CPA than ads without one ($28 against $41). The report calls this its one recommendation with "no caveats or nuance."
Separate cold audiences from warm ones
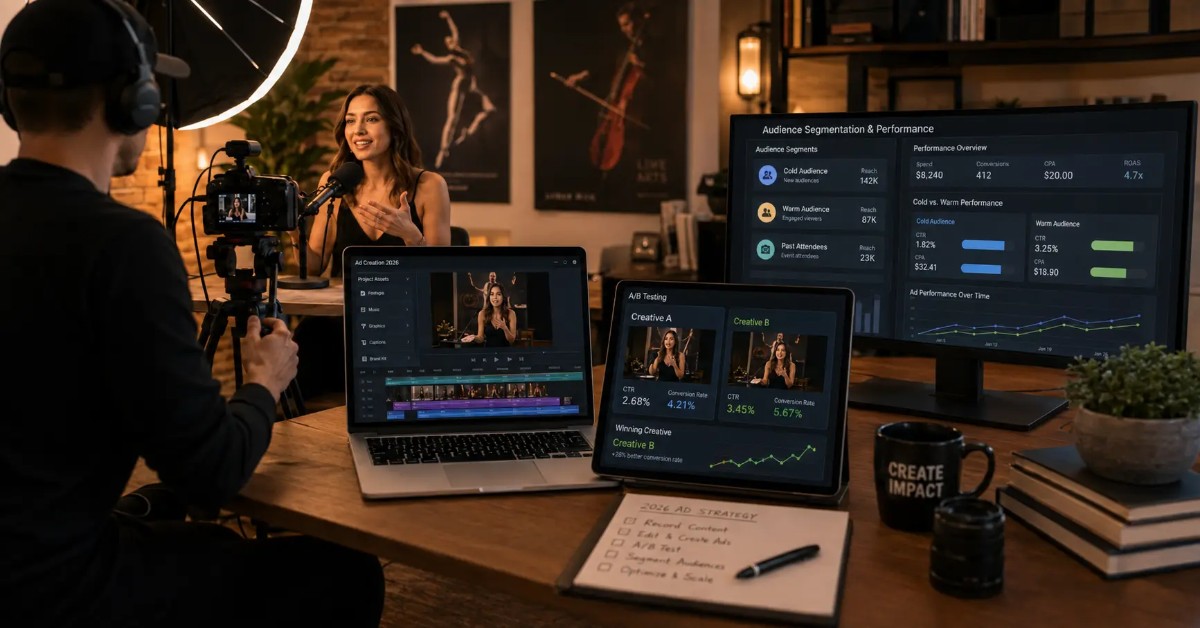
Capacity Interactive's analysis is explicit that newer, less qualified audiences convert at lower rates, and that acquisition work should not ask them for a subscription or a donation. That has a structural consequence. Cold and warm audiences need different creative and different asks, and one campaign aimed at everyone serves both badly.
Cold audiences (people who don't know you) need to understand what the event is and what the evening feels like. The goal is a page view, a video view, or a list signup, judged on cost per page view rather than purchase rate.
Warm audiences (past buyers, site visitors, email subscribers) already know you. They need dates, prices, and availability, and they are where purchase-optimized spend belongs.
Two ad sets with separate budgets is enough to start, and it keeps a small budget from paying cold-audience prices for warm-audience buyers. The same logic shapes audience segmentation more broadly. For the step after the first purchase, see how to earn the second visit.
Creative: production value is not the variable
The benchmark data does not support a single winning format. Capacity Interactive found no "best" post type on Meta. Its advice is to vary assets, copy, and formats, because different stories reach different audiences.
The more useful finding for small organizations concerns video. Large organizations did not achieve higher video view rates than smaller ones, despite bigger production budgets. Performing arts organizations also posted higher video view rates than museums and exhibit-based organizations, which the report attributes to the dynamic nature of the work. Rehearsal footage, backstage access, and short artist interviews therefore compete on equal terms. Meta counts a video view at three seconds, so the opening frame matters more than the finish.
The Doyle survey points the same way from the practitioner side. Respondents said posts featuring local artists, staff, and community members drew their highest engagement. On how organizations turn audience-made content into ad creative, see how arts organizations are using user-generated content.
Search: the channel small budgets underuse
Search catches people who are already looking, and the benchmarks reflect that. In Capacity Interactive's data, paid search averaged a CPA under $4, compared with $10 across all Google campaign types. The report adds an important caveat: most of that search spend was bottom-of-funnel and branded (searches like "boston ballet nutcracker"), so the low CPA partly reflects existing demand.
For nonprofits, much of that inventory is available without paying for it. Google Ad Grants provides up to $10,000 a month in in-kind search advertising to eligible nonprofits, with conditions: a qualifying website, ongoing account quality standards, and active conversion tracking with at least one conversion a month (ticket sales qualify). Across the grants Capacity Interactive manages, average monthly spend was $5,043, about half the allotment. The report attributes this to grant rules that favor traffic quality over spending the full amount. It also notes that many organizations rely on grants for non-branded searches like "things to do in Boston." Those are exactly the searches a newcomer makes.
For scale: one month of grant inventory is close to the entire annual marketing budget of 11 of the 25 organizations in the Doyle survey. Search also increasingly runs through AI answers; see AEO for arts organizations.
How much to spend, and when
Small initial spends buy information rather than tickets. At the small-organization Meta CPA of about $31, a test budget of a few hundred dollars produces only a handful of attributed purchases. That is enough to compare creative and audiences directionally, but too few to prove anything. Treating early spend as research keeps a limited budget from proving the same thing three times.
Timing is an underpriced lever. Capacity Interactive found that Q3 (July to September) gets about 23% less investment than other quarters on average, yet produces some of the year's strongest results and lowest CPMs. That window coincides with season on-sales and subscription campaigns.
Geography is the other lever. Respondents in the Doyle survey reported that hyper-local advertising on community websites and news outlets could be effective, especially in smaller markets. Several also said billboards, radio, print, and sponsored posts on arts and culture websites were costly and had minimal impact.
Fix the event page before buying traffic
Paid media amplifies a page. It cannot fix one. Buying traffic to a page that doesn't convert is the most reliable route to concluding that advertising doesn't work, when the actual failure was the destination.
Check four things before spending: whether the page explains the event in language an outsider understands, shows what the evening feels like, answers the practical questions (start time, length, parking, dress), and makes buying obvious. The broader case for why traffic alone doesn't produce audience is in why event listings alone don't create audience growth.
Measure in your own data, not the platform's
Platform reporting is a modeled estimate that shifts with attribution settings. Capacity Interactive's work with the Cincinnati Art Museum shows how much it can shift. Under Meta's default window (7-day click, 1-day view), three campaigns showed 70 purchases, $2,500 in revenue, and an ROI of -24%. When Capacity Interactive applied the 28-day click-and-view window, the same campaigns showed 126 additional purchases, more than $16,000 in additional revenue, and an ROI of 473%. Museum visitors often consider for weeks and buy at the last minute.
Those windows are no longer stable. On January 12, 2026, Meta stopped returning 7-day and 28-day view-through attribution in its Ads Insights API. Click-based windows, including 28-day click, remain. Results reported through that API will differ from earlier campaigns, and year-over-year comparisons need to account for the change.
The defensible answer is to steer by numbers in your own ticketing system:
Cost per new buyer, rather than cost per ticket, which flatters campaigns that resell to existing buyers
New-buyer share for each campaign, from tagged links matched to ticketing records
Event-page conversion rate
A campaign that produces tickets but no new buyers is a retention campaign. It may be worth running, but it is not growth. The tracking setup is covered in what audience data arts organizations should track.
Where paid ads sit in the wider plan
Advertising is one channel in a system, and rarely the first thing to fix. If the message is unclear, ads amplify it. If the page doesn't convert, ads buy bounces. If nobody outside your list knows you exist, ads are the most expensive way to solve a discovery problem. The difference between the two jobs is set out in event discovery vs. event promotion.
The full sequence (be found, be understood, be chosen, be repeated) is laid out in how to market arts and cultural events. The trade-offs when money is genuinely tight are in how to market cultural events with a limited budget.
How CultureOwl fits in
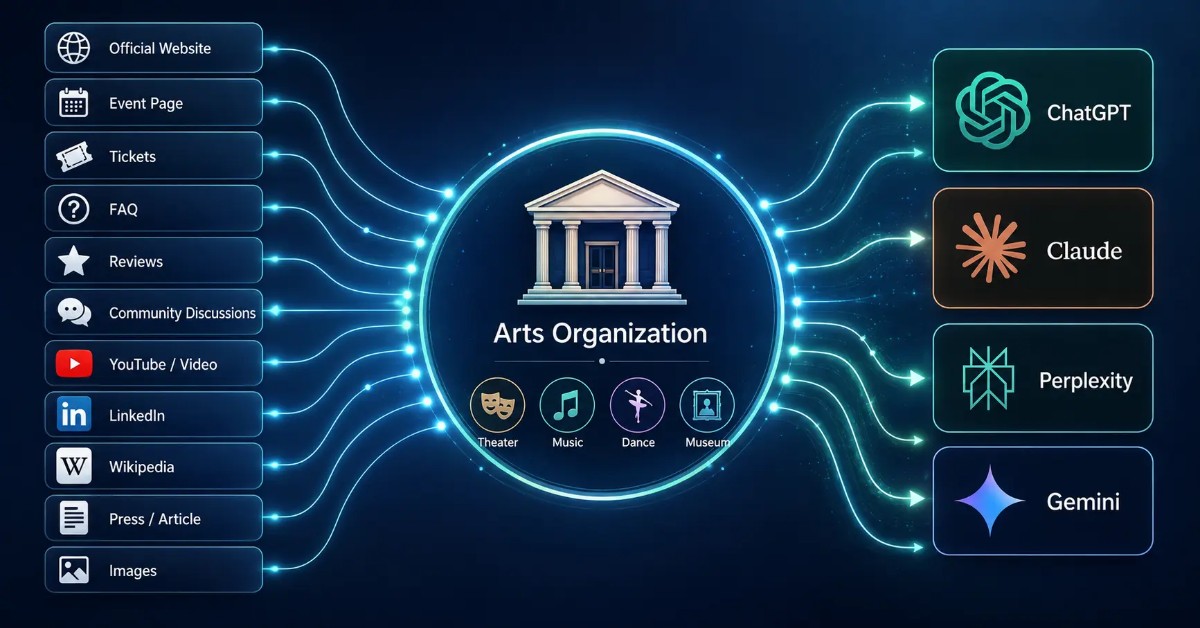
The benchmarks show the cost of reaching people who don't yet know you: small organizations pay the highest CPAs, and the cheapest buyers come from search by people already looking. CultureOwl is event discovery with low-cost ticketing, built for the arts. People across multiple markets browse it for something to do, so organizations are present when that search happens, without a bid behind every impression. Paid budget can then go to the events that need a push rather than to baseline visibility.
Key takeaway
At small budgets, the evidence favors precision over volume. Use a purchase objective rather than a boost, add a call-to-action button, and split cold audiences from warm ones. Don't pay for production value the data says doesn't raise view rates. Claim the search inventory a Google Ad Grant provides. Because platform attribution shifts, judge campaigns on new buyers in your own ticketing data rather than on platform-reported ROI.
Frequently asked questions
Do boosted posts sell tickets for arts organizations?
Rarely on their own. Meta's Help Center presents boosting as an engagement tool, and respondents in a 2024–25 survey of 25 Canadian performing arts professionals said boosted posts were no longer driving ticket sales. Purchase-objective campaigns built in Ads Manager are the better fit for sales.
What is a typical cost per acquisition for arts organizations on Meta?
Capacity Interactive's 2024 Cultural Compass, covering 2023 data from more than 150 arts organizations, found an average Meta CPA of $14.97: $31.29 for small organizations and $12.44 for large ones. Ads with a call-to-action button averaged a 33% lower CPA.
Can arts nonprofits advertise on Google for free?
Eligible nonprofits can receive up to $10,000 a month in in-kind search ads through Google Ad Grants. Accounts must meet quality standards and track at least one conversion a month. Grants Capacity Interactive manages averaged about $5,043 a month in spend.
How should arts organizations measure whether ads work?
Use cost per new buyer and new-buyer share from your own ticketing data. Platform figures shift with attribution settings: one museum's measured Meta ROI moved from -24% to 473% when the attribution window was widened.