

What Audience Data Should Arts Organizations Track?
Arts organizations should track more than ticket sales, revenue and total attendance. Those numbers show what happened, but they do not reveal whether an organization is reaching new people, encouraging them to return or building relationships that continue beyond one event.
The most useful audience data follows the relationship from beginning to end:
Discovery → First action → Return → Deeper engagement → Community
That means understanding:
How people discovered the organization
Which buyers are new
What prompted their first purchase
Which programming interests them
Whether they returned
How frequently they participate
Which campaigns and partners contributed
Whether the relationship extends into classes, membership, giving or other forms of engagement
The goal is not to collect every possible fact about every attendee. It is to answer a more valuable question:
Are we simply generating attendance, or are we building an audience that understands the organization, values its programming and has a reason to remain connected?
When those individual data points are connected and interpreted, they begin to form audience intelligence: a clearer understanding of how the audience relationship is developing and what the organization should do next. That larger subject deserves its own guide. First, organizations need to establish which audience data is actually worth tracking.
Cultural discovery is becoming increasingly multichannel
People no longer discover cultural experiences through one predictable path.
Someone may first encounter an event through Google, Instagram, TikTok, YouTube, an artist’s account, a local publication, a community partner, an email, word of mouth or a cultural discovery platform.
These channels are also becoming more interconnected.
In July 2026, Google introduced Search Console platform properties that let verified Instagram, TikTok, X and YouTube accounts see how their public content performs through Google Search and Discover. An arts organization does not need to use Search Console for the change to matter. It demonstrates that Google increasingly recognizes social posts and video as part of the wider search-and-discovery environment.
Google’s official guidance for AI-assisted search still emphasizes useful, accessible and indexable website content. Social activity is not an automatic ranking advantage, and no organization should assume that every post will be included in an AI-generated answer. However, search, websites, social media, video and editorial coverage increasingly reinforce one another. Google’s generative search features can draw on a wider range of indexed web content and direct users to supporting sources.
For arts organizations, the implication is straightforward:
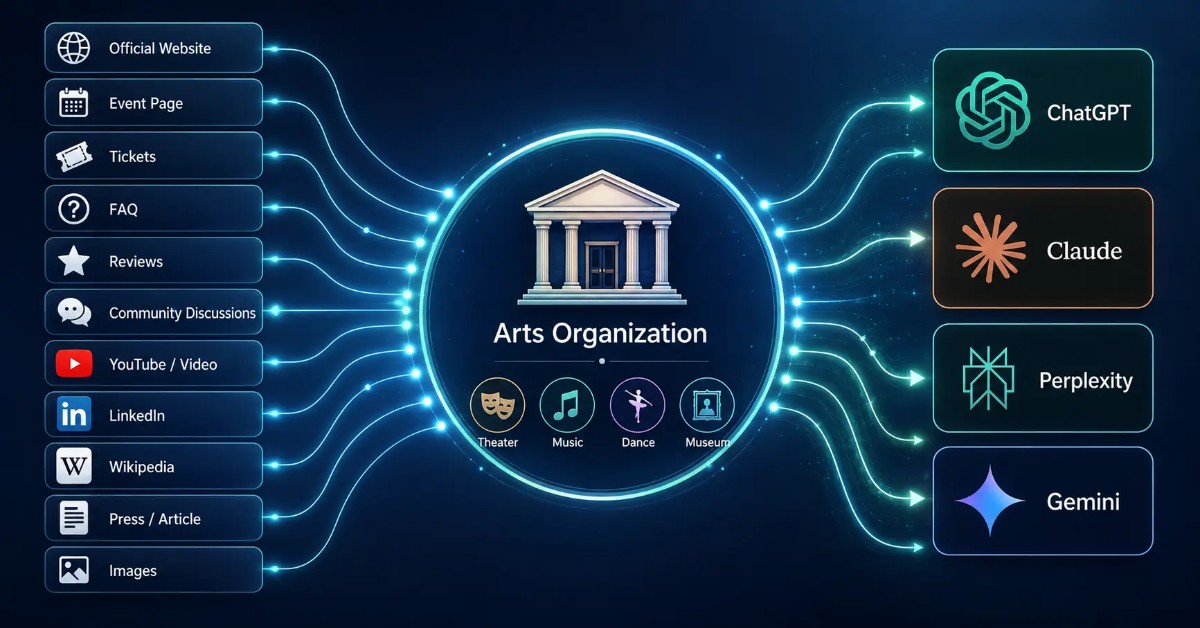
Your digital presence is no longer only your website. It is the combined footprint created by your website, event listings, social media, videos, editorial coverage, artists, community partners and cultural platforms.
A strong website remains valuable because it gives an organization more control over its information, visitor experience and analytics. But not every arts organization has the staff, budget or technical resources to continuously optimize a sophisticated website.
Those organizations can still build a visible and credible presence through consistent event information, social and video content, community relationships, editorial coverage and cultural platforms where people are already looking for things to do.
A coordinated event discovery and promotion strategy gives people several opportunities to encounter an event. The challenge is connecting those channels well enough to understand what happens after discovery.
What $52 million in audience-building research found
The Wallace Foundation’s Building Audiences for Sustainability initiative invested $52 million over five years to support audience-building efforts at 25 performing arts organizations across the United States. Participants tested approaches involving programming, communications, venues and audience engagement while examining whether those efforts could expand audiences and support greater sustainability.
Many participating organizations succeeded in expanding the specific audiences they intended to reach. But those gains did not necessarily translate into greater overall attendance or stronger finances.
The final research also challenged what one participant called the “old myth of the long slow escalator”: the assumption that someone naturally moves from first-time attendee to repeat attendee, subscriber and eventually donor. Another participant summarized a more realistic lesson: organizations need to “meet people where they’re at.”
The lesson is not that arts organizations should stop trying to deepen audience relationships. It is that every next step must be supported by relevance, experience, communication and a meaningful reason to return.
The Foundation’s Data and Deliberation report provides another important reminder:
“Data is not a magic bullet.”
Data helped participating organizations question assumptions, better understand audiences and refine their strategies. But gathering information was not enough. Staff still had to decide which findings mattered, what they meant and what should change as a result.
A useful process looks like this:
Define the question → Collect the right information → Analyze the result → Test a response → Measure what changed → Refine the next action
An end-of-season attendance total does not create that cycle. It tells the organization what happened after most opportunities to respond have passed.
“We sold more tickets” does not explain audience growth
Tickets sold, revenue, capacity and attendance belong in every operational report. But they are blended totals.
A single total cannot tell an organization:
Whether growth came from new or existing buyers
Whether first-time buyers returned
Whether active buyers attended more frequently
Whether lapsed buyers were reactivated
Whether one unusually popular program carried the season
Which programming developed lasting interest
Where new attendees discovered the event
What it cost to acquire them
Which community partners contributed
Whether attendees remained connected afterward
Two organizations can each sell 25,000 tickets while showing completely different levels of audience health.
One may be acquiring and retaining new buyers across several programs. The other may depend on one blockbuster event while losing repeat attendees and spending more each season to replace them.
The attendance total hides that difference.
Sector benchmarks can provide useful context. The TRG Arts & Culture Benchmark, offered in partnership with the National Endowment for the Arts and SMU DataArts, compares anonymized ticketing data from more than 400 participating arts and cultural organizations. That can help leaders understand broader trends, but each organization still needs its own metrics to explain what is happening inside its audience.
Before buying another analytics platform, organizations should examine what their existing systems already capture. Ticketing platforms commonly contain buyer, transaction, date and program information. Website analytics can reveal traffic and campaign activity. Email platforms record communication behavior.
What is often missing is not another large collection of data. It is a shared set of definitions, clearly named metrics and a process for reviewing them while there is still time to act.
The audience journey arts organizations should measure
Audience data becomes easier to understand when it is organized around the relationship rather than around the software that stores it.
Stage | What the organization needs to understand |
|---|---|
Discovery | Are we reaching people beyond those who already know us? |
First action | What moved someone to purchase, register, follow or attend? |
Return | Did that person come back? |
Deeper engagement | Is participation expanding across visits or programs? |
Community | Is the person staying connected beyond one transaction? |
The following 10 metrics provide a practical foundation.
1. New-buyer volume and share
New-buyer volume is the number of people or households making their first recorded purchase during a defined period.
New-buyer share shows what percentage of all buyers were new:
First-time buyers ÷ Total buyers × 100
Track both figures.
An organization might increase first-time buyers from 1,000 to 1,200, which initially appears positive. But if its overall buyer base doubled, the percentage of buyers who were new may have declined.
The reverse can also happen. New-buyer share may rise because active-buyer participation fell rather than because acquisition improved.
This metric helps determine whether the organization’s audience-development strategy is genuinely extending participation beyond existing buyers, subscribers, followers and email contacts.
2. Discovery source
Discovery source attempts to identify where someone first learned about an event or organization.
Possible sources include:
Search
Social media
Video
Editorial coverage
An artist or performer
A friend or family member
A community partner
CultureOwl or another discovery platform
Outdoor or print promotion
The organization’s own email
Discovery source is not necessarily the same as the final measurable click before purchase.
A person may discover an event through an article, watch an artist interview, visit the organization’s Instagram account and later search for the event before buying. A last-click report may credit the search or final email even though awareness began elsewhere.
Organizations should distinguish among:
Discovery source: Where awareness began
Conversion source: The measurable interaction associated with the purchase
Transaction channel: Where the sale was completed
Tracked links, referral information, promotional codes and a concise post-purchase question can produce a useful directional picture. Attribution will never be perfect, but it can still become reliable enough to guide spending and partnerships.
3. Cost per new buyer
Cost per new buyer shows how much an organization spent to acquire each first-time buyer:
Acquisition campaign cost ÷ Attributed first-time buyers
This is different from cost per order or cost per ticket.
A campaign may generate many purchases from people who already know the organization while attracting relatively few new buyers.
Compare acquisition cost with:
First-order revenue
Second-visit conversion
First-time buyer retention
Attendance frequency
Program affinity
Longer-term participation
The cheapest source is not always the strongest source. A channel that costs more initially may bring in people who return more frequently or participate in several ways.
4. Program and genre affinity
Program affinity identifies the kinds of experiences a person or household chooses.
Depending on the organization, those categories may include dance, theater, jazz, classical music, comedy, exhibitions, film, family programming, festivals, lectures or classes.
Behavior is generally more useful than assigning someone a fixed persona.
A person may attend jazz, contemporary dance and a food festival. Those choices reveal more than a broad label such as “traditionalist” or “culture lover.”
Track:
Which programs attract the most first-time buyers
Which first events produce the strongest retention
What people attend next
Which genres are frequently purchased together
Which programs reactivate lapsed buyers
Which experiences lead to classes, membership or giving
Consistent categories are essential. “Jazz,” “live jazz” and “jazz concert” should not become three unrelated classifications in the database.
5. First-experience signals
Transaction data shows what someone purchased. It does not explain how the experience felt or whether the person encountered barriers that may prevent another visit.
Useful first-experience signals include:
Overall satisfaction
Intent to return
Ease of purchasing
Clarity of pre-event information
Ease of arrival and entry
Accessibility
Perceived relevance
Interest in related programming
Barriers to returning
A concise first-time attendee survey might ask:
What brought you to this event?
How would you rate the overall experience?
What would make you more likely to return?
Survey selectively and connect every question to a decision the organization could make.
Stated intent should also be compared with behavior. Someone may say they intend to return and still never purchase again. The second visit remains the stronger result.
6. First-time buyer retention
First-time buyer retention is the percentage of new buyers who purchase again within a consistent period:
First-time buyers who return ÷ All first-time buyers in the original cohort × 100
The cohort matters.
Someone who first purchased last week has not had the same opportunity to return as someone whose first purchase occurred 11 months ago. Compare buyers who have had approximately the same amount of time to make another purchase.
A year-round museum may use a 12-month window. A seasonal theater, orchestra or dance company may measure whether someone returns during the following season. An annual festival may need a longer period.
This metric deserves its own line in leadership and board reporting. An organization can attract thousands of first-time buyers while retaining very few, creating an expensive cycle in which it must continually replace one-time attendees.
7. Second-visit conversion
First-time retention is the broader outcome. Second-visit conversion makes it easier to respond during the year.
Track the percentage of first-time buyers who make another purchase within:
30 days
60 days
90 days
The same season
The following season
Also track the typical number of days between the first and second purchase.
If most successful second purchases occur within 45 days, waiting six months to recommend another event misses the strongest opportunity.
Break the result down by:
First event attended
Discovery source
Ticket price
Program type
Follow-up communication
First-experience feedback
One event may attract many new people but generate little repeat attendance. Another may attract fewer first-time buyers but produce much stronger retention.
Neither result automatically makes one program better. It reveals the role each program is playing.
8. Attendance frequency
Frequency measures how often a person or household participates during a defined period.
Rather than relying on one average, group the audience into useful bands:
One visit
Two visits
Three to five visits
Six or more visits
An average of 1.8 visits could describe thousands of one-time attendees balanced by a small group of subscribers. It could also describe a healthier audience in which many people attend twice.
Those situations require different strategies.
One-time buyers may need a relevant second recommendation. Two-time buyers may be ready for a flexible multi-event offer. Frequent participants may value membership, advance access, giving or volunteer opportunities.
The purpose is not to push everyone toward the same subscription model. It is to understand the depth of the relationship.
9. Pacing by audience segment
Overall ticket pacing can hide changes in who is buying.
Instead of reporting:
We have reached 75% of our ticket goal.
Report:
Active-buyer sales are at 88% of goal, new-buyer sales are at 54%, and lapsed-buyer sales are at 42%.
A practical framework might define:
New: No previous completed purchase
Active: Purchased within the past 18 months
Lapsed: Last purchased 18–36 months ago
Deeply lapsed: Last purchased more than 36 months ago
The exact windows should reflect the organization’s programming cycle. An annual festival and a museum with daily admission should not necessarily use the same definitions.
Pacing by segment reveals where to act while tickets are still on sale.
Strong active-buyer sales combined with weak new-buyer sales call for stronger discovery and acquisition. Strong acquisition combined with weak repeat participation points to a retention problem.
10. Lapsed-buyer reactivation
Lapsed-buyer reactivation measures the percentage of inactive buyers who return during a defined period or campaign:
Lapsed buyers who purchase again ÷ Eligible lapsed buyers contacted × 100
Do not treat everyone who has stopped attending as one audience.
Separate people based on:
Time since their last purchase
Previous attendance frequency
Program affinity
Subscription or membership history
Donation history
Prior spending
Someone who attended five dance performances and then stopped needs a different message from someone who purchased one family ticket eight years ago.
A useful reactivation report includes the number contacted, the number returning, revenue generated, cost per reactivated buyer and the program that brought them back.
“Come back—we miss you” is rarely enough. The message should provide a specific and relevant reason to reconsider.
Audience data and audience segmentation are not the same thing
Audience data and segmentation are related, but they perform different jobs.
Audience data records individual signals
Audience data includes the facts stored across an organization’s systems:
A ticket purchase
An event-page visit
An email click
A membership
A donation
A survey response
A program preference
A partner referral
On their own, these are records of activity.
Segmentation organizes people for action
Segments might include:
First-time buyers who have not returned
Active repeat buyers
Recently lapsed attendees
Family-program buyers
Jazz buyers
People referred by a particular partner
Class participants who have not attended a performance
Segmentation answers:
Who should receive a different message, offer or experience?
Creating dozens of segments that all receive the same newsletter does not create meaningful segmentation.
Deeper analysis then connects the individual records and segments to explain why people behave differently, how their relationship is changing and what action may improve the result. That is where basic audience data begins to become audience intelligence.
Measure community partners instead of assuming their value
Community partnerships are frequently described as valuable but left unmeasured.
Give each partner a unique tracked link so the organization can compare:
Visits
Event-page engagement
Ticket sales
First-time buyers
Revenue
Program interests
Retention after the first purchase
Google Analytics supports UTM campaign parameters that identify the source, medium and campaign referring a visit. Organizations can create tracked links with the Google Campaign URL Builder. Google recommends consistent parameter naming so one campaign is not fragmented across several reports.
Immediate sales should not be the only measure of partnership value.
A partner may produce fewer initial purchases but introduce people who later return, register for classes or engage with other programming. That relationship may be more valuable than a short-lived traffic spike.
Measure the combination behind a sold-out event
A sold-out event rarely has one cause.
The full campaign may include:
Editorial coverage that introduced the story
Social or video content that created familiarity
A CultureOwl listing that helped someone evaluate the experience
A community partner that shared the event
Google searches from people looking for more information
An email reminder that completed the purchase
Last-click reporting may credit only the email. That is useful for understanding the final conversion action, but it does not explain the complete strategy that built demand.
A better campaign review asks:
What introduced the event?
Which content increased interest?
Which partners generated qualified visits?
Which channels reached first-time buyers?
What created urgency?
What completed the transaction?
Which buyers returned afterward?
No analytics system can perfectly reconstruct every audience journey. Consistent tracking can still reveal which combinations repeatedly contribute to strong results.
Bring discovery, promotion and ticketing together
Audience information often sits across disconnected systems.
Search and social platforms report visibility. Website analytics report visits. Partners report their own activity. Ticketing platforms report transactions. Customer systems hold purchase history. Staff then try to combine everything afterward.
CultureOwl helps connect more of that journey by bringing cultural discovery, organization visibility, event promotion, ticketing and reporting into one arts-focused platform. Its current reporting includes event- and organization-level performance, ticket sales, attendance, exports and integrations with existing systems.
When CultureOwl ticketing is used, more of the path from discovery through purchase and attendance can remain connected. Organizations using another ticketing platform can still use tracked links and analytics to evaluate CultureOwl referrals and promotional activity.
The value is not simply having more reports. It is being able to understand how discovery, promotion, partnerships, transactions and audience retention work together.
Start with a manageable process
Arts organizations do not need to build an advanced analytics department immediately.
Begin by agreeing on:
What counts as a new, active and lapsed buyer
Whether each metric uses individuals or households
Which program and genre categories will remain consistent
How campaigns and partner links will be named
Which five metrics leadership will review first
A practical starting dashboard should answer:
Are we reaching new people, are they returning, and are we doing it at a sustainable cost?
Review ticket pacing and active campaigns weekly during major selling periods. Review second visits, partner performance, frequency and acquisition costs monthly. Review completed retention cohorts seasonally or annually.
Every review should end with four questions:
What changed?
Why do we think it changed?
What will we do differently?
When will we know whether that action worked?
That is how audience data becomes a management tool rather than another end-of-season report.
Are you building attendance or building community?
Ticketing data records transactions. Deeper audience data reveals whether people remain connected between them.
A cultural community includes people who attend events, follow an organization, read its stories, share programming, participate in classes, volunteer, donate, refer friends and engage across several programs.
Not every activity needs to become a headline metric.
The more important questions are:
Are people choosing to remain connected?
Are they participating in more than one way?
Are they recommending experiences to others?
Are they moving between digital engagement and attendance?
Does the organization understand what they value?
As discovery becomes more distributed, a relationship may begin with an unknown viewer, reader or social follower:
Unknown viewer → Recognized follower → First-time attendee → Repeat participant → Active community member
Not everyone will follow the same path. That is one of the Wallace research initiative’s most important findings.
The goal is not to force everyone onto a loyalty escalator. It is to create meaningful opportunities for people to discover art and culture, participate in ways that fit their lives and build a relationship that has a reason to continue.
Audience data shows what happened.
Using the right audience data helps an organization understand whether that relationship is actually being built.